")
")
")
")
")
")
")
Creation of graphics and data visualization
Data visualization is an important method to present complex data and statistical results in a clear and understandable way. The aim is to create visual representations that make the results recognizable at a glance. This is exactly where the Statistical Consulting and Data Analysis Leonardo Miljko comes in.
Leonardo Miljko's experts offer comprehensive advice and support in creating graphics and data visualizations. The needs of the customer and the requirements of the target group are taken into account. Whether bar charts, line charts or pie charts - the experts at Leonardo Miljko create professional and meaningful charts in seconds.
Particularly noteworthy is the creation of Levey-Jennings diagrams, which are widely used in medical diagnostics and laboratory technology. This is a chart for monitoring the quality of laboratory results. Leonardo Miljko's experts create these diagrams in seconds, thus ensuring fast and reliable laboratory quality monitoring.
Thanks to Leonardo Miljko's comprehensive advice and support in creating graphics and data visualizations, data and statistical results are presented in an understandable way. Customers can rely on professional and meaningful diagrams that can serve as a basis for decisions.
"Used Source: ChatGPT"
- Details
- Written by Statistische Daten Analyse - Leonardo Miljko
- Category: Creating graphs and data visualization
- Hits: 12554
Creating charts and data visualization
Data visualization is an essential part of data analysis to get a quick, concise and visual summary of the information contained in large amounts of data. With data visualization, you can present complex data and information in a simple and easy-to-understand way.
- Details
- Written by Statistische Daten Analyse - Leonardo Miljko
- Category: Creating graphs and data visualization
- Hits: 15500

Reporting and statistical graphics
Thorough and meaningful reporting is essential to make informed decisions. Whether it's evaluating data, creating market analysis, or evaluating business results, the ability to present complex information in a clear and concise manner is essential.
- Details
- Written by Statistische Daten Analyse - Leonardo Miljko
- Category: Creating graphs and data visualization
- Hits: 14495
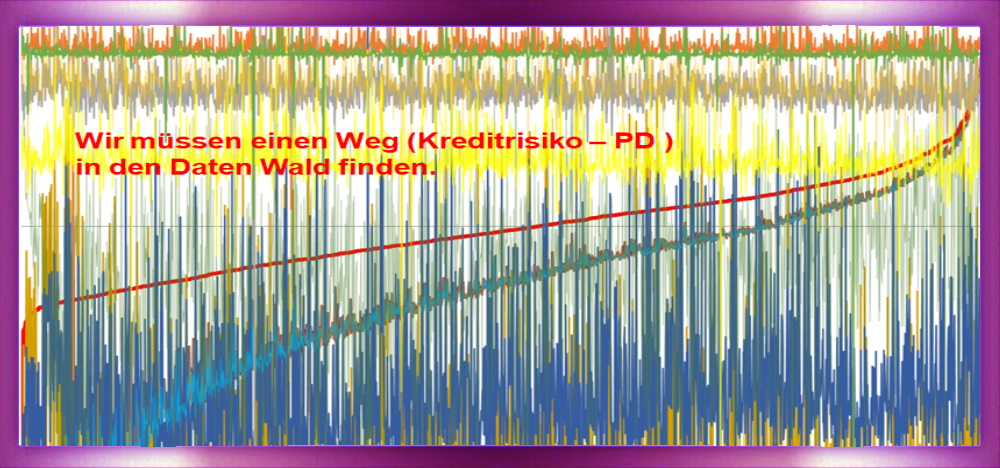
Visual representations: understand data more easily
Data is omnipresent these days and is collected and analyzed in a wide variety of areas. It can be difficult to filter out the important information from the many facts and figures and to recognize connections. This is where the importance of visual representations comes into play.
- Details
- Written by Statistische Daten Analyse - Leonardo Miljko
- Category: Creating graphs and data visualization
- Hits: 2365
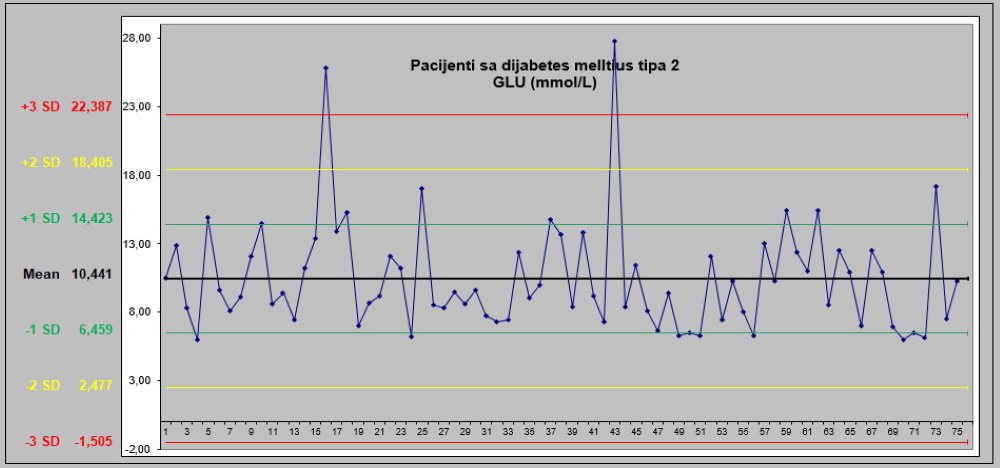
Create a Levey-Jennings chart in seconds
Levey-Jennings diagrams are an important tool in hematology and medical diagnostics. They help to quickly identify and monitor deviations in laboratory results. But how do you actually create such a diagram?

