")
")
")
")
")
")
")
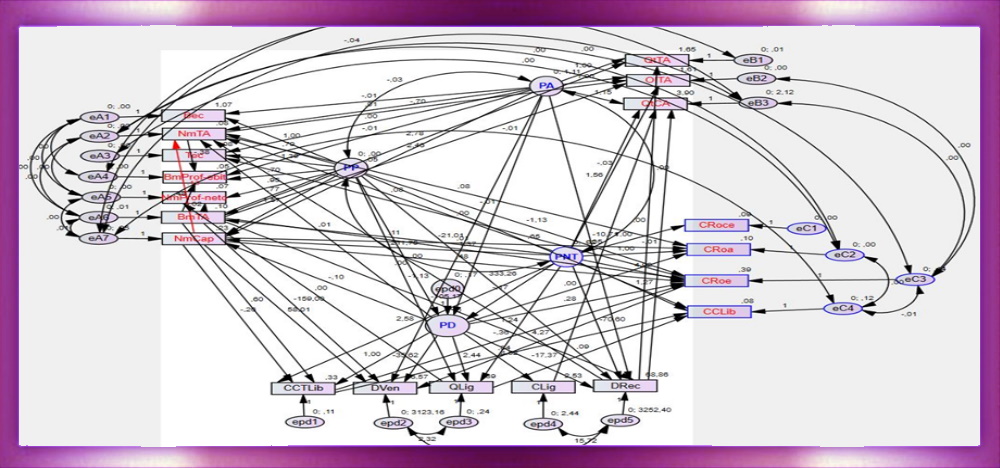
Ø Chi-square (CMIN)
The CMIN table can be found under: View → Text Output → Model fit → CMIN
|
CMIN |
|||||
|
Model |
NPAR |
CMIN |
DF |
P |
CMIN/DF |
|
Default model |
35 |
37,400 |
18 |
0,061 |
1,900 |
|
Saturated model |
50 |
0 |
0 |
||
|
Independence model |
10 |
4800,00 |
40 |
0 |
120,000 |
v NPAR
NPAR = Number of parameters for each model (default, saturated and independent).
NPAR is the number of parameters in the model.
In the saturated (newly identified) model, there are 50 parameters.
There are 35 parameters for our tested (default) model.
For an independence model (one where all paths are deleted) there are 11 parameters (variances of 11 variables).
v CMIN or χ2 or Chi-square
CMIN or χ2 is the chi-square statistic that compares the tested model and the independence model to the saturated model.
The chi-square test tests the fit of the data by structural analysis of covariance assessing the fit of the samples and the covariance matrix (Barrett, 2007, Berry, 1994).
CMIN are 37,400 for our tested (default) model.
v DF
DF = degree of freedom measures the number of independent values that can be varied without disturbing the constraints in the model.
DF are 18 for our tested (default) model.
v P or χ2significance
P or χ2significance or Likelihood Ratio is the statistical significance of the model.
|
Interpretation:
|
|
|
A value p ≥ 0,05 indicates an acceptable fit |
Joreskog & Surbom, 1996 |
|
|
www.StatistischeBeratung.de |
A value p = 0,061 it indicates an acceptable fit
v CMIN/DF or χ2/df *
CMIN/DF or (χ2/df) is the relative chi-square index, and it is how much the fit of the data to the model is reduced by dropping one or more paths.
|
Interpretation:
|
|
|
If the CMIN/DF value is ≤ 2 it indicates an acceptable fit |
Byrne, 1989, S.55 |
|
If the CMIN/DF value is ≤ 2 it indicates an acceptable fit |
Tabachnick & Fidell, 2007 |
|
If the CMIN/DF value is ≤ 3 it indicates an acceptable fit |
Kline, 1998 |
|
If the CMIN/DF value is ≤ 3 it indicates an acceptable fit |
Homburg/Giering, 1966, S.13 |
|
If the CMIN/DF value is ≤ 5 it indicates a reasonable fit |
Marsh & Hocevar, 1985 |
|
If the CMIN/DF value is ≤ 5 it indicates a reasonable fit |
Wheaton et al, 1977, S.84 ff. |
|
A CMIN/DF ratio of less than 2,0 |
Bentler and Bonett, 1980; Carmines and McIver, 1981; Kelloway, 1996 |
|
A CMIN/DF ratio of less than 3,0 |
Hu and Bentler, 1999 |
|
A CMIN/DF ratio of less than 5,0 |
Marsh et al., 2004 |
|
|
www.StatistischeBeratung.de |
CMIN/DF = 1,900 it indicates an acceptable fit
| Cite this article in your research paper: |
| APA Statistische Beratung Leonardo Miljko (datum) How to interpret SEM model fit results in AMOS. Retrieved from https://www.StatistischeDatenAnalyse.de/images/services/How_to_interpret_SEM_model_fit_results_in_AMOS.pdf . |
|
Harvard
Statistische Beratung Leonardo Miljko January 10, 2020 How to interpret SEM model fit results in AMOS. viewed datum < https://www.StatistischeDatenAnalyse.de/images/services/How_to_interpret_SEM_model_fit_results_in_AMOS.pdf > |
Wichtiger Hinweis: Der Originalinhalt ist auf Kroatisch. Die Übersetzung ins Deutsche und Englische erfolgte über einen Web-Übersetzer. Wir entschuldigen uns für die Fehler.

